
Product Update
NeuronUP now features evolution charts so you can see your users’ progress visually! This update was one of the most requested product features and is now a reality thanks to NeuronUP Score.
What is NeuronUP Score?
NeuronUP Score is the score that measures users’ progress in NeuronUP.
How can I use NeuronUP Score?
- See your users’ progress visually;
- perform a better follow-up of your users;
- demonstrate your work with data to your users and their families;
- compare your users’ progress in one cognitive function against another.
Evolution charts in NeuronUP Score
In NeuronUP Score you will find two sections: the user score and the activity score.
1. User score
In this section you can see the evolution chart of each user visually over a period of time, as shown in the image below.
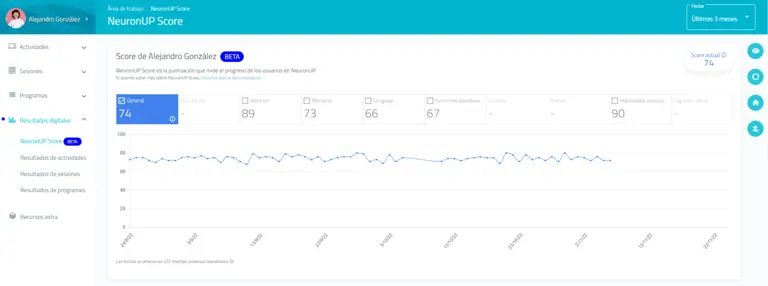
Below, we proceed to explain the elements of the chart:
Types of Score
It is important to understand the different types of score shown on the chart:
1. Current score
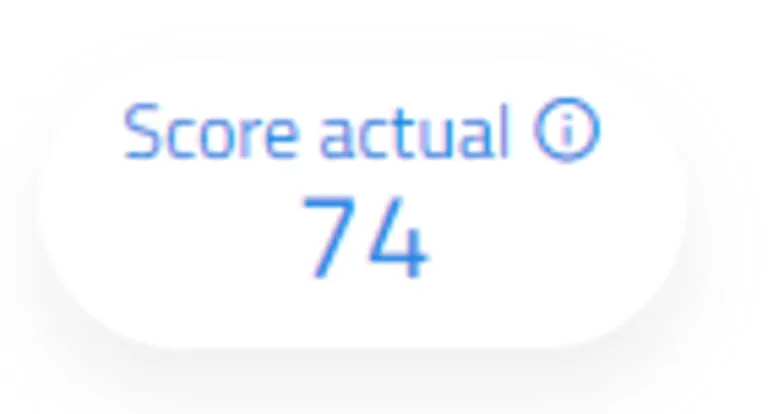
The current score is the average of the scores obtained in the last three months. This score does not change depending on the selected period; it is fixed. It serves as a reference to know the user’s current status and will appear on other screens of the application such as the user’s profile.
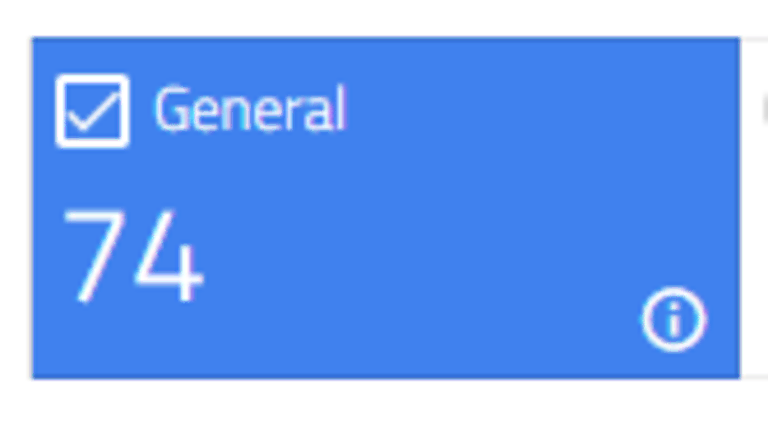
2. General score
The general score on the evolution chart is the average of the scores obtained in the selected time interval. Therefore, it will change depending on the selected time interval.
This score will always match the current score if we select a three-month date range. In addition, it may happen that the current score and the general score coincide even if the selected time interval is different.
Date range
The time range can be modified from the filter located at the top right. For now you can select the last month, the last 3 months, the last 6 months or the last 12 months. In future updates we will increase the selectable date range.
Score updates
Score values do not appear in real time; they are calculated once a day, specifically at 00:00 UTC.
Compare cognitive functions
Also, as shown in the image below, the evolution charts allow you to compare the user’s general score with two specific functions. In this case, attention and language.
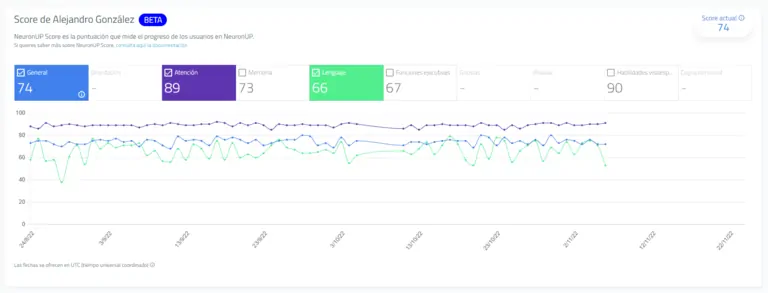
To select a function to compare, simply click on it.
You can select three blocks at the same time: the general score and two cognitive functions, or three cognitive functions.
2. Activity score
On this NeuronUP Score screen you can also view the scores of each activity worked on during the selected time period.
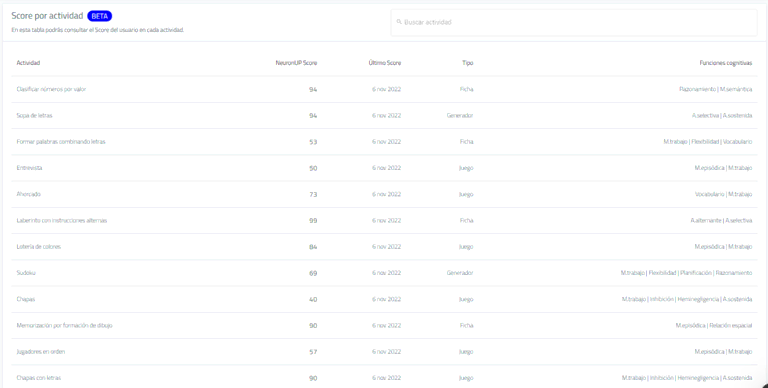
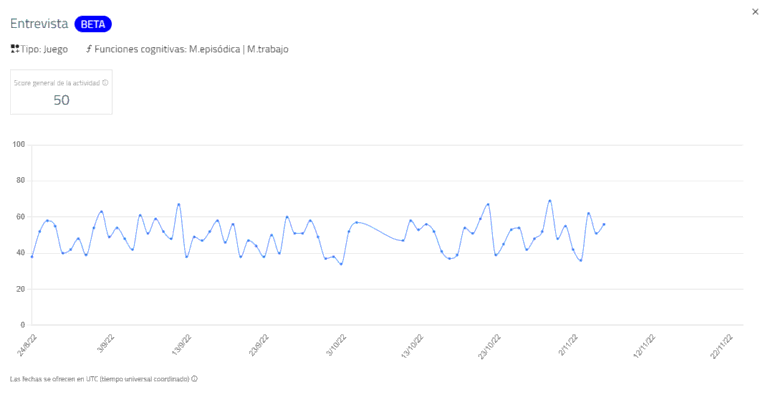
By clicking on the activity, the different scores for that activity in the selected time interval will be displayed. In the following example, we show the activity Press Conference:
How do I access NeuronUP Score?
- Log in to NeuronUP,
- click on Digital Results in the left-hand menu of the screen,
- click on Score,
- select the user whose score you want to view.
- you can now access that user’s Score.
The score is subject to changes and modifications
During the Beta period scheduled improvements and changes will be applied taking into account your comments and contributions, so it should be borne in mind that the score may vary.
We need your suggestions or feedback
If you have any suggestions, there is something you don’t understand, or you simply want to give us your opinion about the evolution charts and NeuronUP Score, write to us at [email protected] .
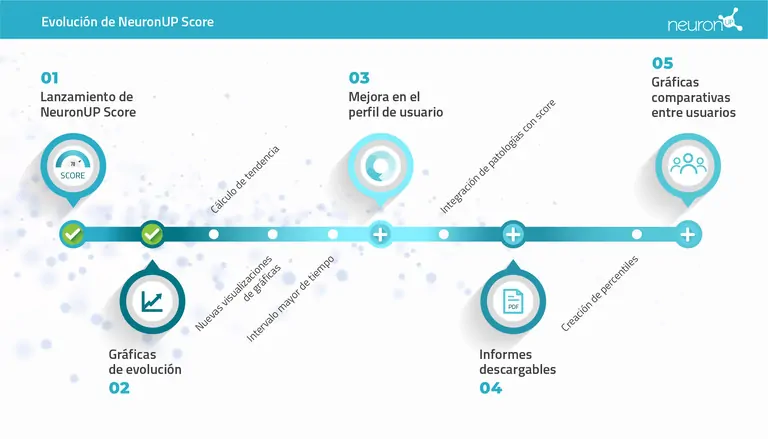
What’s coming…
NeuronUP Score has only just begun. Below, we show what we are working on right now and that will become a reality in the coming months:
NeuronUP Score is in beta and that means this is only just getting started.
If you are a client, take a look at NeuronUP Score and the evolution charts within the platform. If you don’t yet have NeuronUP, request a free trial of the platform here.


“This article has been translated. Link to the original article in Spanish:”
[NOVEDAD] Llegan las gráficas de evolución a NeuronUP
 Why pursue a Master’s in Child and Adolescent Neuropsychology?


Leave a Reply