Do you want to measure the progress of your patients with evolution graphs? Would you like to compare your patients’ data with their past results? Are you interested in displaying intervention data to your patients and their relatives? In this article, we explain how to achieve this thanks to NeuronUP Score.
What is NeuronUP Score?
NeuronUP Score is the score used to measure the patients’ progress in NeuronUP, offering the possibility to compare it with their previous scores. In addition, in the future, it will allow comparison with the scores of similar patients.
Types of Score
In NeuronUP you can find 4 different types of score. Two are related to the patient and two to the activity.
1. General Score
The general score is the average of the scores obtained by the patient in the selected time span.
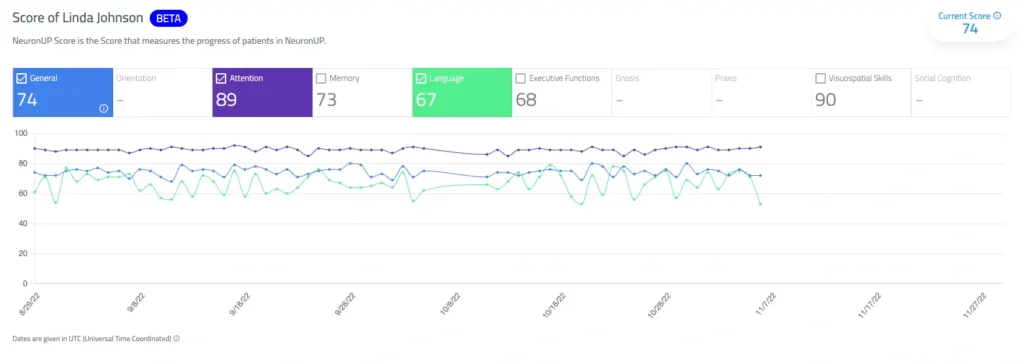
You can view the evolution of the overall score in the line graph of the NeuronUP Score screen.

2. Current Score
The current score is the average of the scores obtained in the last three months. It is the frame of reference to know the current situation of the patient.

3. Score of a cognitive function
The score of a cognitive function is the average of the scores obtained in that cognitive function in the selected time span.
You can view the evolution of the cognitive function score on the line graph of the NeuronUP Score screen.

4. Overall score of the activity
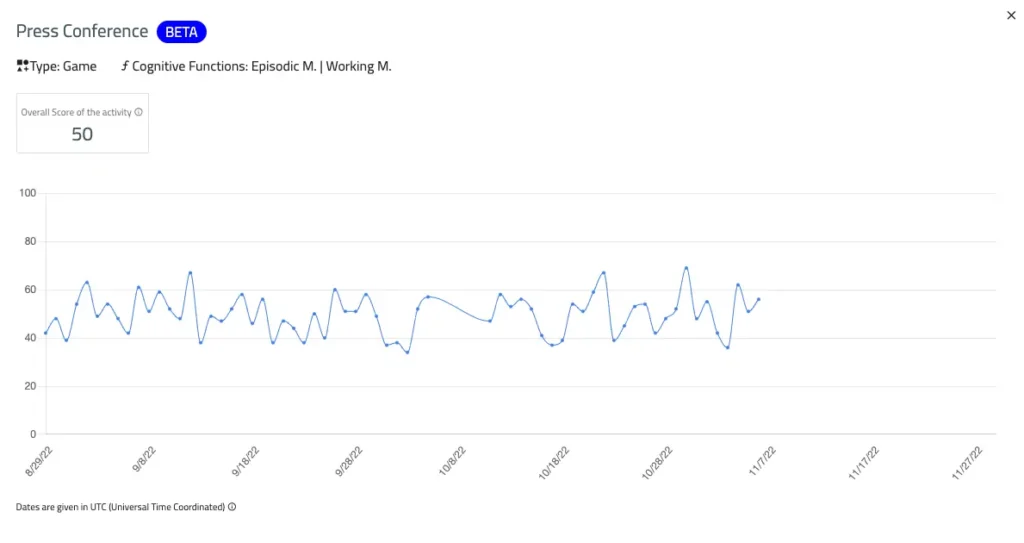
The overall score of the activity is the average of the scores obtained in that activity in the selected time span.

NeuronUP Score’s benefits for your intervention
- View the progress of your patients visually.
- Better track your patients.
- Show your work with data to your patients and their families.
- Compare your patients’ progress of one cognitive function versus another.
Learn more about
NeuronUP
Try it for free
The platform that 3,500+ professionals use on a daily basis
Evolution Graphs
What are evolution graphs?
NeuronUP’s evolution graphs allow you to see the progress of your patients visually.
Graph types
1. Trend line
The trend filter will be activated by default in the patients’ evolution graph, allowing you to clearly visualize the progression of the score.
It is very useful in long-term interventions that show a high dispersion in the results, as we can see in the following image.

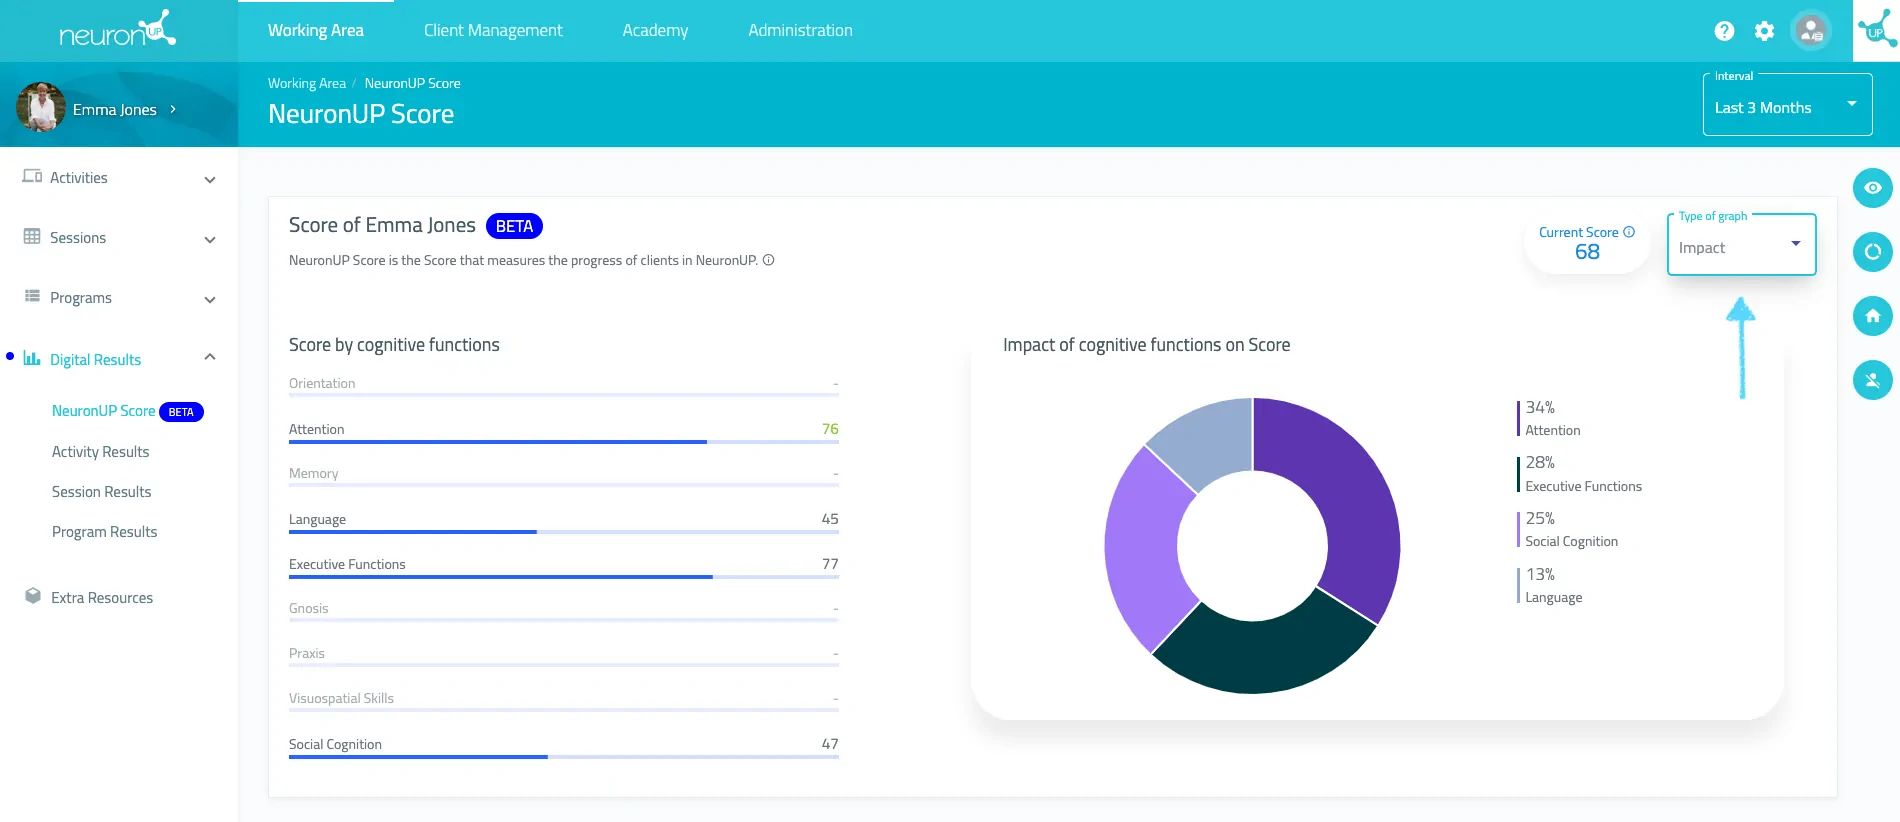
2. Impact graph
With this feature you will be able to view the importance of each area of intervention worked on through NeuronUP, in the Score. In this way, you will have the possibility to redefine the scope of the intervention if necessary.

If you want to know more about NeuronUP Score, check here for the documentation.